I still run across curmudgeons who flat out reject techniques like object-oriented programming (especially inheritance and polymorphism), protocols and protocol-oriented programming (especially composition), generics, and closures. On a conscious level, the curmudgeons usually reject these technique because of their supposed “massive” performance cost. On a subconscious level, the curmudgeons don’t understand these technologies. So do we give up all hope or do we accept the fact that compiler designers have come up with brilliant optimizations that ameliorate the use of such high-level technologies? We should believe in Swift’s compiler designers. Do we realize that there are great tools like Xcode Instruments that help us find awkward implementations of these techniques and give us the opportunity to come up with our own optimizations? Yes.
There are costs to these high-level features, but I would argue that in most cases, language compiler optimizations, operating systems enhancements, and faster hardware (like solid state drives and multi-core processors), make up for the costs. Sure, once in a while you’ll have a use case where advanced code features don’t pay off, i.e., code is badly written or not used for the intended purpose.
Most of the time, these advanced features save software development boutiques enormous amounts of time and resources. Advanced language features usually let us do more by writing less and very expressive code. Time is saved because team members can easily read each other’s semantically clear code. Since the code is readable and logically organized, it can be extended, reused, debugged, and maintained easily.
But by goodness, nobody’s perfect, not even me ;-). Software keeps getting more and more complex. Users keep demanding more, better, and faster features. Problems will occur. Some apps are so slow that people just delete them.
Do we find out why our apps are so slow by using just print statements and breakpoints? I hope not, but I’ve seen more than a fair share of Stone Age “optimization” techniques. No. We turn to the darn good tools that already come bundled free with Xcode.
Using Xcode Instruments to Identify Performance Problems
The Xcode Instruments’ Time Profiler template is the best template to start with when looking for app performance problems and/or determining how to improve performance. According to Apple, the Time Profiler template “performs low-overhead time-based sampling of processes running on the system’s CPUs.”
We’re going to use the Time Profiler to analyze the performance of my sample app’s code. Please download it from GitHub. In simplest of terms, Time Profiler collects information about your app while it’s running, determines how long each of your functions takes to run, and also figures out the percentage of CPU cycles each of your functions is using. It gathers the same data about iOS SDK functions. The percentage of CPU cycles from 0% to 100% at each sample point is shown over time on a graph called the “timeline” or “track.” There are multiple tracks. The top track aggregates all the data from all individual thread and CPU core tracks. The Time Profiler is a very powerful tool as it shows your app’s performance in real time, thus reflecting surges or lulls in CPU usage. We’ll walk through an example.
Your Profiling Environment
Before we begin, realize that, when profiling your code, especially when comparing two different approaches to the same problem, it’s imperative that you compare apples and apples, not apples and bananas. In other words, if you’re profiling an algorithm and trying to optimize it, you want to use the same device (or simulated device) with the same configuration.
When I compared the performance of functions showEmployee() and show() from my sample app in the demo below, I ran and profiled each method on the same iPhone 8, with the same configuration. When preparing my iPhone 8 for profiling, I first shut down all running apps. Since the code I was studying didn’t involve any type of connectivity, I shut down WiFi, Bluetooth, and cellular. Of course, if you’re profiling networking code, like communications with a REST API, you’ll need to have WiFi or cellular.
The key takeaway here is that you want to minimize, preferably eliminate, the number of (random) variables that may skew Time Profiler analysis and results. Imagine if you’re profiling an algorithm and your iPhone starts up Background App Refresh… Your analysis may be tainted — artificially skewed so that you believe your algorithm is slower than it really should be. Imagine if you profile one algorithm when nothing is running in the background on your iPhone, profile a similar algorithm while your iPhone performs a background refresh, and then compare the two results (data sets). Is this a meaningful comparison?
Using Instruments’ Time Profiler Template
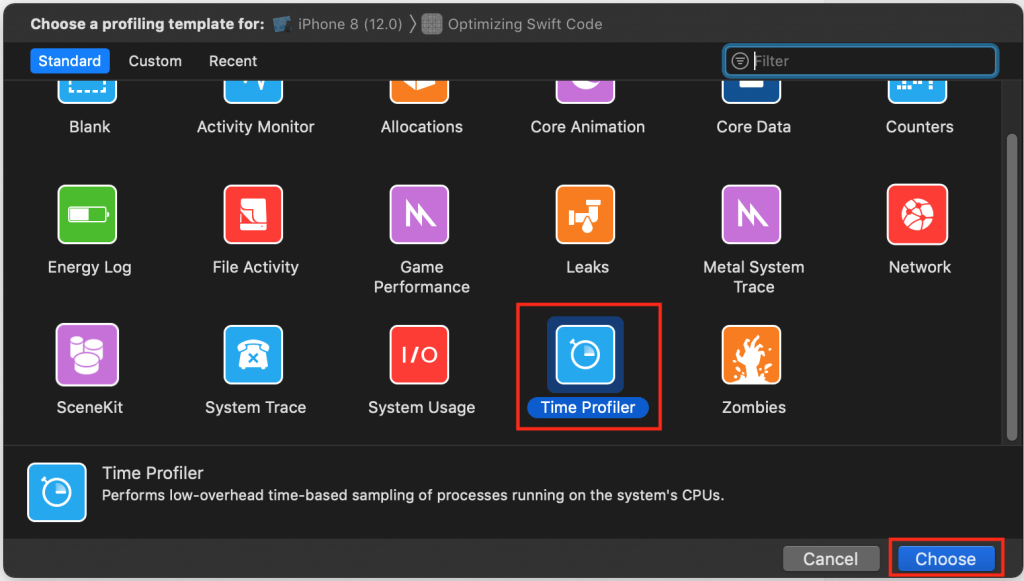
Let’s walk through the profiling of my “Optimizing Swift Code” sample project. Open the project in Xcode. Click and hold the Build and then run the current scheme button until you see the down arrow. Click the down arrow and then select the Profile option from the context menu, like so:
The Choose a profiling template for: dialog will open. Select the Time Profiler template and click the Choose button:
The Time Profiler template window will open, ready to sample and render performance data of my “Optimizing Swift Code” app. I’ll refer to the following image as the “map:”
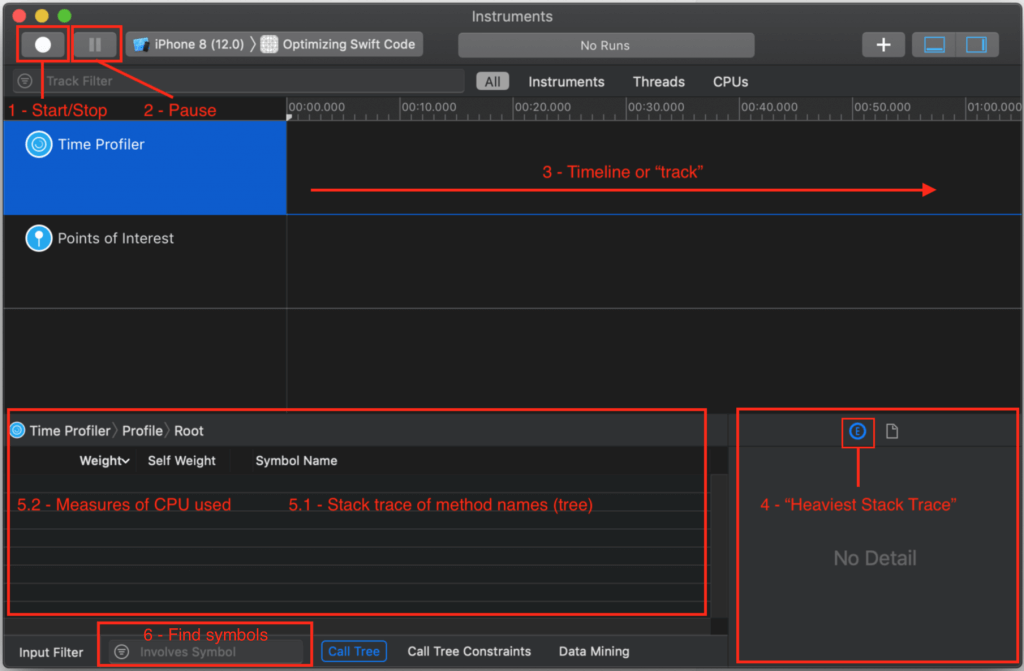
I’ve numbered my annotations to correspond with the general sequence of the workflow you use to analyze app performance. I’ll also refer to these annotations in the following discussion.
To begin profiling, press the record toggle button — what I call the “1 – Start/Stop” (map) button:
When you feel you’ve sampled enough data, press the “2 – Pause” button or “1 – Start/Stop” toggle (see map). Now it’s time to examine the profile (sample data collected). Since I’m running code in the background via GCD, I can scroll down to see activity per thread and per core:
Analyzing Your Profile
Now it’s time to analyze the recorded profile data. You generally start by clicking into an area of activity on the track/timeline or by highlighting a “slice” of the timeline. Remember that you can not only look at the top/aggregate track, but also inspect each thread or core:
When you click on a single time/data sample or highlight a slice, the corresponding code executing at that time of that selection is shown in what I annotated on my map as the “4 – Heaviest Stack Trace,” “5.1 – Stack trace of method names (tree),” and “5.2 – Measures of CPU used.” You all should know that functions are pushed on and popped off the stack, that functions calling other functions builds a stack trace, and that “Heaviest Stack Trace” means high CPU usage (cycles).
– functions in the “Heaviest Stack Trace” pane; and/or,
– thick, high, and blue activity on the top track, or possibly in thread and core tracks.
I’m interested in two regions on the timeline. Why? because they show non-trivial CPU activity:
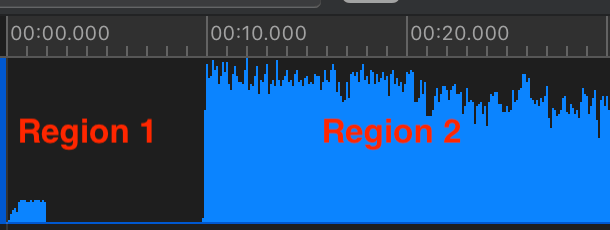
After I’ve selected a slice of the timeline, here “Region 1,” I first look at the “4 – Heaviest Stack Trace” pane (see map) for method names I recognize with a person icon next to them. The person icon indicates my code; other icons represent iOS calls. The “4 – Heaviest Stack Trace” pane shows me code with high CPU usage.
In this case, I also expected to see certain functions at startup; code that I wrote. I know my own code. I clicked on one of my method names in “4 – Heaviest Stack Trace” so that its stack trace and symbols (function/class/struct names) would be shown in the “5.1 – Stack trace of method names (tree)” and “5.2 – Measures of CPU used” pane (see map):
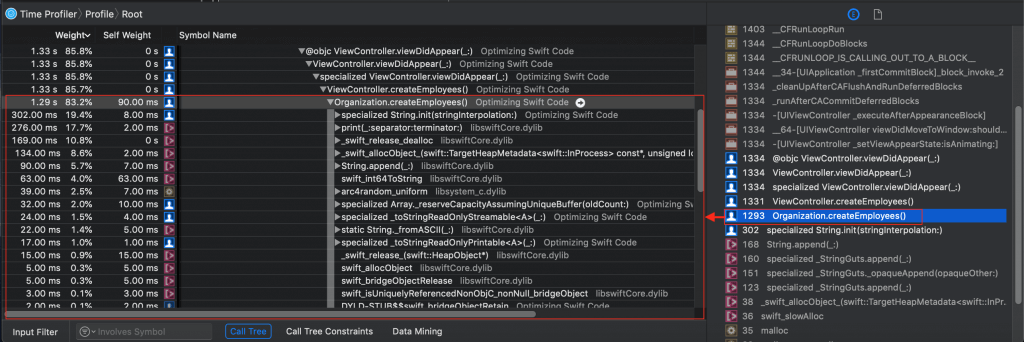
Notice all the detail. And notice that I can expand a symbol (function) name to see everything being called by it. If you go into my “Optimizing Swift Code” project, you can see how the Organization.createEmployees() method is called at app startup. Look in project file Organization.swift and you’ll find this code:
import Foundation

class Organization {

    var employees: [Employee] = []

    func createEmployees() {

        for count in 1...count {

            let employeeID = "employee" + String(count)
            let age = Int(arc4random_uniform(47)) + 18

            let employee = Employee(firstName: "first"+String(count), lastName: "last"+String(count), age: age, streetAddress: String(count)+" Main St", zip: "90210", employeeID: employeeID)

            employees.append(employee)

            print("Employee \(count) created.")

        } // end while

    } // end func createEmployees()

} // end class Organization
But… I don’t have to switch to Xcode to look at my code.
If I double-click on the symbol Organization.createEmployees() in the “5.1 – Stack trace of method names (tree)” and “5.2 – Measures of CPU used” pane, I jump right to the source code:
You see that Instruments provides annotations (metrics) on performance (like the yellow arrow marked “47x”), but suppose you want serious detail, like assembly code. Click on the Show side-by-side source/disassembly view button:
Look at all that information. You can even see ARC memory management in action, like retain and release statements. Note that ARC has overhead, so when using classes (reference types), you may have to carefully architect your code — and possibly optimize it.
Now that you have an idea of how the Instruments’ Time Profiler template works, let’s look at optimizing some Swift code.
Optimizing Swift Code
Those busy Swift compiler engineers have done a great job of making Swift fast and light-weight. Back in Swift 2.0, there were more opportunities for developers using the language to optimize their code. With the release of Swift 4.2, the compiler is pretty darn optimized — but that doesn’t prevent people from writing bad code. Still, developers need to legitimately optimize code, especially code in which there are complex relationships, mountains of data, and/or extensive calculations.
Dynamic Dispatch
Let’s look at an example involving dynamic dispatch. I urge you to pause at some point while reading this article to take a look at an excellent Apple Developer blog post entitled “Increasing Performance by Reducing Dynamic Dispatch”. You should understand dynamic dispatch by now, even the Swifties, but especially if you used to develop in Objective-C.
My sample code is not Earth-shatteringly innovative, it’s not supposed to be. I’m using a simple example so you can understand the language concepts and optimization tools.
Remember “Region 2” in my Time Profiler trace? Here’s a reminder:
Let’s look at what Instruments showed me when I selected a slice of this part of the timeline:
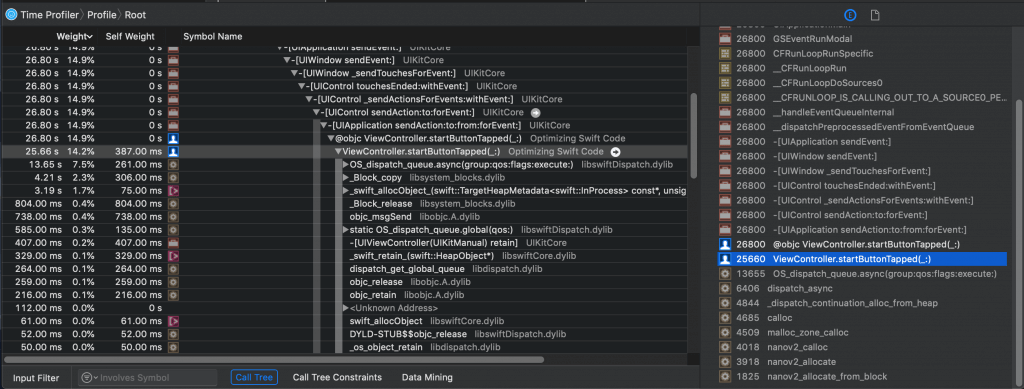
Hmmm… I see ViewController.startButtonTapped(_:), which is close, but I’m not seeing what I’m interested in. (That’s because this is a simple example, I’m running code in the background using GCD, and therefore iOS is using as many threads/cores as necessary to keep my app responsive.)
I’m comparing the performance of two methods, showEmployee() and show(). See file ViewController.swift in my “Optimizing Swift Code” sample project:
    @IBAction func startButtonTapped(_ sender: Any) {

        while true {

            DispatchQueue.global(qos: DispatchQoS.QoSClass.default).async {

                for count in 0...count-1 { // 0...999999

                        //let employeeInfo = self.organization.employees[count].showEmployee()
                        let employeeInfo = self.organization.employees[count].show()

                        DispatchQueue.main.async {

                            self.newEmployeesTextView.text += employeeInfo
                            print("\(employeeInfo)\n")

                        }

                } // end for count in 0...count-1

            } // end DispatchQueue.global

        } // end while true

    } // end func startButtonTapped
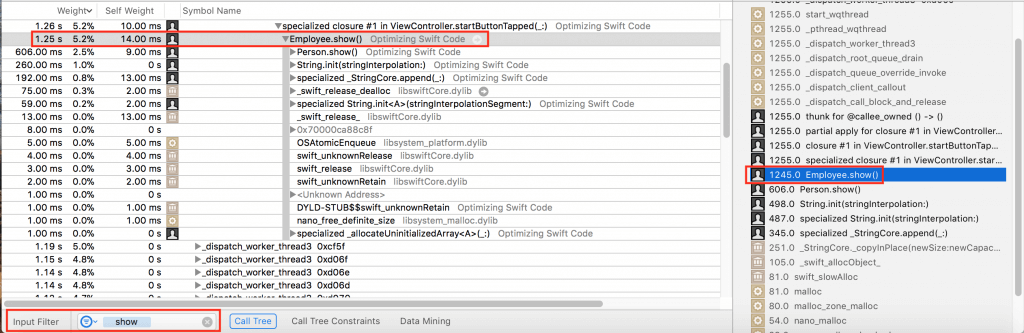
Remember “6 – Find symbols” in my map? I ran multiple profiling sessions, several to investigate showEmployee() and several for show(). Hey, call me a stickler for details, but I don’t trust one data sample. I’ve got two math minors with an emphasis on statistics, so yes, I profiled multiple times to make sure my claims were substantiated. I’ll present two representative samples from my research (and yes, I switched out of dark mode because my eyes were getting tired).
Here’s what I found out about the performance of Employee.show():
Here’s what I found out about the performance of Employee.showEmployee():
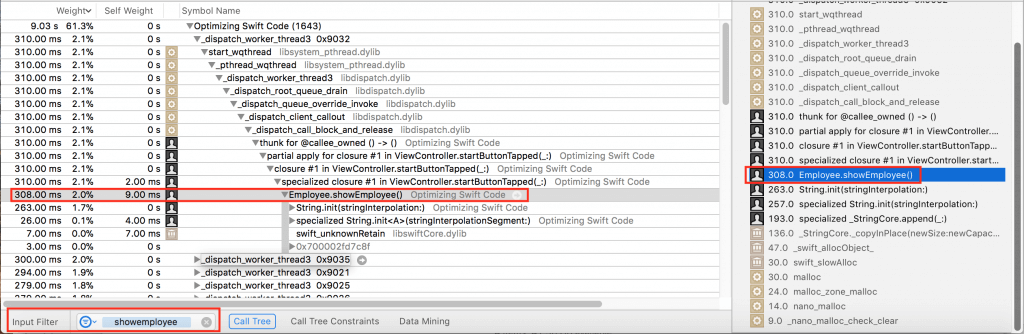
What I found was that Employee.showEmployee() is conservatively about 2.5 times faster than Employee.show(). Yes, I know… Is saving less than a millisecond really an optimization? In this app, no. If you’re working on some app that repeats a call millions of times, maybe optimization by taking out dynamic dispatch would be worth your effort.
So why is Employee.showEmployee() faster? Let’s look into the code. First, look in file People.swift:
import Foundation

class Person {

    /*
     final var firstName: String
     final var lastName: String
     final var age: Int
     final var streetAddress: String
     final var zip: String
    */
    var firstName: String
    var lastName: String
    var age: Int
    var streetAddress: String
    var zip: String

    init(firstName: String,
         lastName: String,
         age: Int,
         streetAddress: String,
         zip: String) {

        self.firstName = firstName
        self.lastName = lastName
        self.age = age
        self.streetAddress = streetAddress
        self.zip = zip

    }

    func show() -> String {
        let line = """
        First name: \(firstName)
        Last name: \(lastName)
        Age: \(age)
        Street Address: \(streetAddress)
        Zip Code: \(zip)
        """

        return line
    }

} // end class Person
Notice method show() above. It is overriden in file Employees.swift, shown here:
import Foundation

class Employee: Person {

    var employeeID: String
    var retirementAge: Int = 60

    init(firstName: String,
         lastName: String,
         age: Int,
         streetAddress: String,
         zip: String,
         employeeID: String) {

        self.employeeID = employeeID
        super.init(firstName: firstName, lastName: lastName, age: age, streetAddress: streetAddress, zip: zip)
    }

    func isRetirementReady() -> Bool {
        if age >= retirementAge {
            return true
        }
        else {
            return false
        }
    }

    override func show() -> String {
        var line = super.show()
        line += "Employee ID: \(employeeID)\n"
        line += "Retirement Age: \(retirementAge)"
        return line
    }

    final func showEmployee() -> String {
        let line = """
        First name: \(firstName)
        Last name: \(lastName)
        Age: \(age)
        Street Address: \(streetAddress)
        Zip Code: \(zip)
        Employee ID: \(employeeID)
        Zip Code: \(zip)
        """

        return line

    }

}  // end class Employee
Notice that I’ve indulged in some overkill here to make a point. Not only have I completely rewritten the show() methods in the form of showEmployee(), but I’ve also marked showEmployee() as final which “allows the compiler to safely elide dynamic dispatch indirection.”
Whole Module Optimization
Remember earlier that I said that the Swift compiler is getting really smart? As I understand it, the optimizations that I’ll discuss from here onwards are already turned on by default. Even so, I believe it’s instructive and helpful for you to understand what the Swift compiler is doing with your code.
Look at the default Xcode 10 Build Settings under Swift Compiler – Code Generation:
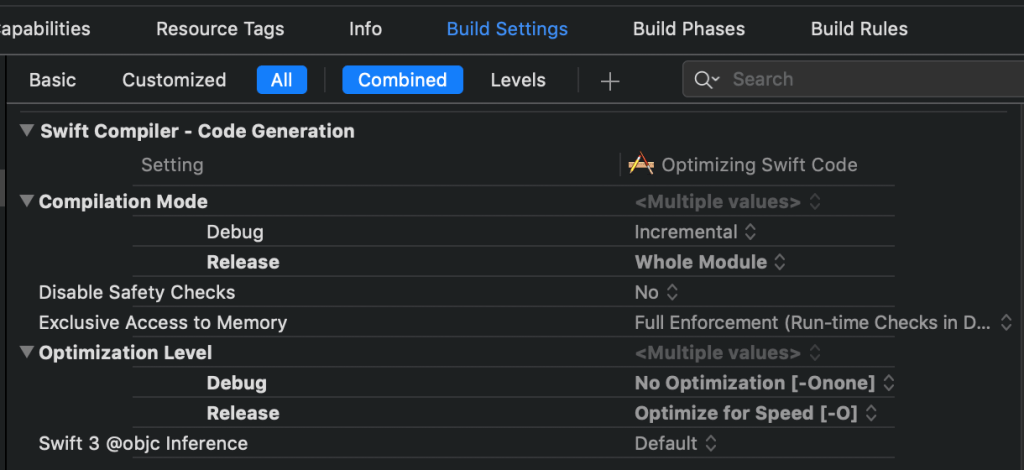
Notice that Compilation Mode is set to Incremental for Debug and that Optimization Level is set to No Optimization for Debug. These settings make for fast build times. It should be obvious why performing no optimizations is faster. Incremental building means only recompiling files that have changed since the last build, accounting for updated dependencies. Finally, the Swift compiler “can compile many files in parallel on multiple cores in your machine.”
Compilation Mode is set to Whole Module for Release. Optimization Level is set to Optimize for Speed for Release. That makes for fast apps that you publicly distribute.
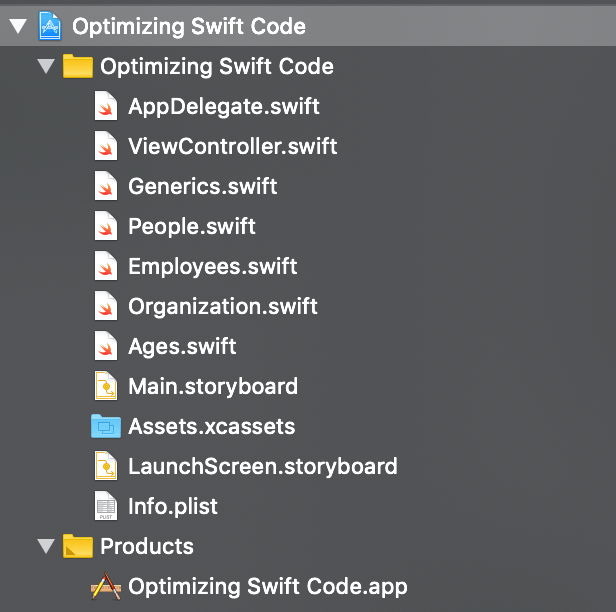
I made it a point to break my code into as many logical modules as possible in my “Optimizing Swift Code” sample project:
Profiling this and many other projects for customers, I’ve seen Whole Module Optimization speed up my public releases. In fact, the changes I made to enhance performance in the previous section were done in Debug. When I removed the final keyword in Release, my profiling seemed to confirm that the Swift compiler inferred it as an optimization.
There’s one language feature where Whole Module Optimization has an additive effect on another one. We’ll discuss this in the next section.
Generics
Think about a generic function like the one included with my sample app. You’ll find it in Generics.swift:
func exists<T: Equatable>(item:T, inArray:[T]) -> Bool {

    var index:Int = 0
    var found = false

    while (index < inArray.count && found == false)
    {
        if item == inArray[index]
        {
            found = true
        }
        else
        {
            index = index + 1
        }
    }

    if found
    {
        return true
    }
    else
    {
        return false
    }

} // func exists
The compiler looks at this function and realizes that “it must be able to handle any type T” that conforms to Equatable. Think about the complexities involved in generics. You’re writing code that ideally should be able to handle any type.
Swift already supports an optimization called generic specialization. It turns out that Whole Module Optimization also optimizes generics. Why?
I know this is a relatively old video, but you should watch the whole thing to find out.
I proved to myself that Whole Module Optimization sped up calls in my sample project to my exists generic function. I profiled the project with Whole Module Optimization on and then profiled it with the setting turned off. This is how you learn about powerful tools.
Simple Optimizations
Say you’re designing a data-intensive app and you need to pick the fastest data structures to use in your code. Go to a site like this one, look at the Big-O complexity chart, review the data structures, and look at the time requirements of their operations. Then pick the data structures that balance your requirements with speed.
ARC Memory Management
ARC memory management has overhead, but I’ve read multiple scientific and commercial journal articles that do not conclude that reference types and reference semantics are slower than value types and value semantics.
In my own work, I’ve never been able to prove that, in general, one was faster than the other, as long as sound best practices were used in development across the board.
While writing this article, I actually coded an entire Swift project that performs the same task by 1) entirely using reference types and semantics and 2) entirely using value types and semantics. After multiple sessions with the Time Profiler, I couldn’t find any significant difference between the two.
Nevertheless, I’ve seen scenarios in which ARC did degrade performance when misused, for example, creating too many references, or using large numbers of reference types when value types could be used instead. One has to strike a balance. For example, if we replace a bunch of references with values, what happens when we have to constantly change and copy those values?
Conclusion
I encourage you to play with my project’s Swift code and its Swift Compiler – Code Generation settings — and then practice with the Time Profiler to analyze and possibly optimize the code. If not my code, use your own code. But practice, practice, and practice with the Time Profiler.
You need to be able to find bottlenecks in your code and then be able to optimize them. You’ll feel a bit overwhelmed if you’ve never used Instruments before. I’ve been using its templates for years and still find it a bit overwhelming. But not using Instruments is a travesty. It offers so many ways to solve problems more easily than using brute force.
By brute force, I mean only fixing bugs and making optimizations by using print statements and maybe some breakpoints.
Please don’t give up on tools like object-oriented programming, protocols and protocol-oriented programming, generics, and closures just because you’ve had a few bad experiences or because you heard they have “high overhead.” When used right, these tools can actually reduce the amount of code you write and speed up your apps. They can certainly help with code maintainability, readability, and reusability.
You have excellent tools with Xcode. Use them.